- home
- the basics
- the share
- trading shares
- Process to buy shares
- Why buy shares?
- How old to buy shares?
- Custodial account
- tax rules on shares
- styles of trading
- buying (going long)
- Shorting (going short)
- Stop losses
- How to choose a share
- Fundamental analysis
- Technical analysis
- Stock portfolio
- Trading courses
- Stock trading practice accounts
- brokerage account
- What is trading software
- Share newsletters
- the stock market
- Trading guide
- Advanced
- Glossary
- free stuff!
Technical analysis explained
Technical analysis is the second stage in picking a stock to buy/sell. You should already have a list of companies whose financial performances match your criteria through basic fundamental analysis. Technical analysis is about studying stock chart patterns.
There are many patterns in charts that suggest whether a stock is about to rise or fall. These patterns are taught thoroughly in stock market trading courses. As well as patterns in the chart, there are several indictors that suggest whether the stock is going up or down. Again, indicators are taught in trading courses.
Example
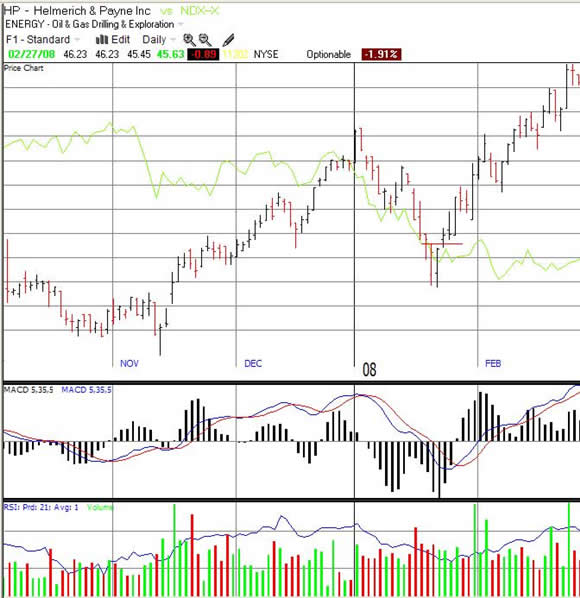
Below in the main chart area is a horizontal red line, below it are a red and black vertical bar which technical analysts would call a “pipe bottom”. Technical analysts suggest that when the stock rises above the high of the down (red line) day then the stock should be considered a “buy” as long it is backed up by sound fundamental analysis. As you can see the stock went on to rise around 23%.
Please be aware the example above is just an example and although “pipe bottoms” are considered a strong stock market signal, they can’t guarantee profits.
If a stock satisfies your fundamental and technical analysis, then the time is right to buy or short the stock.
For detailed technical analysis you will need to purchase charting software. See the list of recommended charting software.
Practice Trade!
SharesExplained.com
- Loading Quotes...
Free newsletter and gift!
Sign up now!SharesExplained.com
Stock market basics
Shares explained
Stock charts explained
Stock dividends explained
Stock Split Explained
Stock attributes
Why do shares move up and down?
How do I read a stock quote?
Understanding company financial statements
Rights issue of sharesThe process of buying shares
Why buy shares
Age limit for trading shares
Custodial account
Tax rules on shares
Styles of trading
Buying (going long)
Shorting stock (going short)
Stop losses explained
Picking shares
Fundamental analysis
Technical analysis
Portfolio/Watchlist
Trading courses
Practice accounts
Brokerage accounts
Trading software
NewslettersStock market explained
Stock exchanges
Indexs
Sectors
Bull/bear market
What market to buy shares
Factors that affect the stock market
When does the stock market open?Stock market trading guide
Step by step guide to trading shares
Practice accounts
Brokerage accounts
Trading courses
Trading software
Newsletters/tipsites
5 golden rules when trading shares
The risk:reward ratio
LeverageStock market games
Stock market 60
Stock market suicideAdvanced stock market trading
IPO (Initial Public Offering)
Automated trading
Bonds/gilts
Exchange traded funds (ETF's)
FOREX
Mutual Funds
Penny shares
Spread betting
Options Explained


